Dine Brands Global, Inc. Reports Fourth Quarter and Fiscal 2021 Results

Fourth Quarter 2021 Domestic Average Weekly Unit Sales for Both Brands Exceed Pre-Pandemic Levels for the Second Consecutive Quarter
Fourth Quarter 2021 Consolidated Revenues Increased 17% to $229.6 Million
Fourth Quarter 2021 Gross Profit Improved by 43% to $96.5 Million
Applebee’s and IHOP Franchisees Opened 46 New Restaurants in Fiscal 2021
GLENDALE, Calif.–(BUSINESS WIRE)–Dine Brands Global, Inc. (NYSE: DIN), the parent company of Applebee’s Neighborhood Grill + Bar® and IHOP® restaurants, today announced financial results for the fourth quarter and fiscal 2021.
![]()
“This past year delivered strong growth for our business that can best be defined by our top-line results, Applebee’s record-setting full-year comp sales performance relative to 2019, marked improvement in gross profit, and the ability to resume returning capital to shareholders. We’re encouraged by our fourth-quarter results as our disciplined strategies continue to drive strong underlying performance. As we continue to evolve the company by making strategic investments in the business, we’ve broadened our vision to include our impact on the environment, society, and growing in a more sustainable way,” said John Peyton, chief executive officer of Dine Brands Global, Inc.
Vance Chang, chief financial officer, added, “We ended the year in a position of strength. Our highly franchised business model enabled us to generate meaningful adjusted free cash flow, supported by a stable recovery at our two strong brands. Looking ahead, we will continue to create value for our shareholders by returning capital while concurrently investing to unlock long-term growth.”
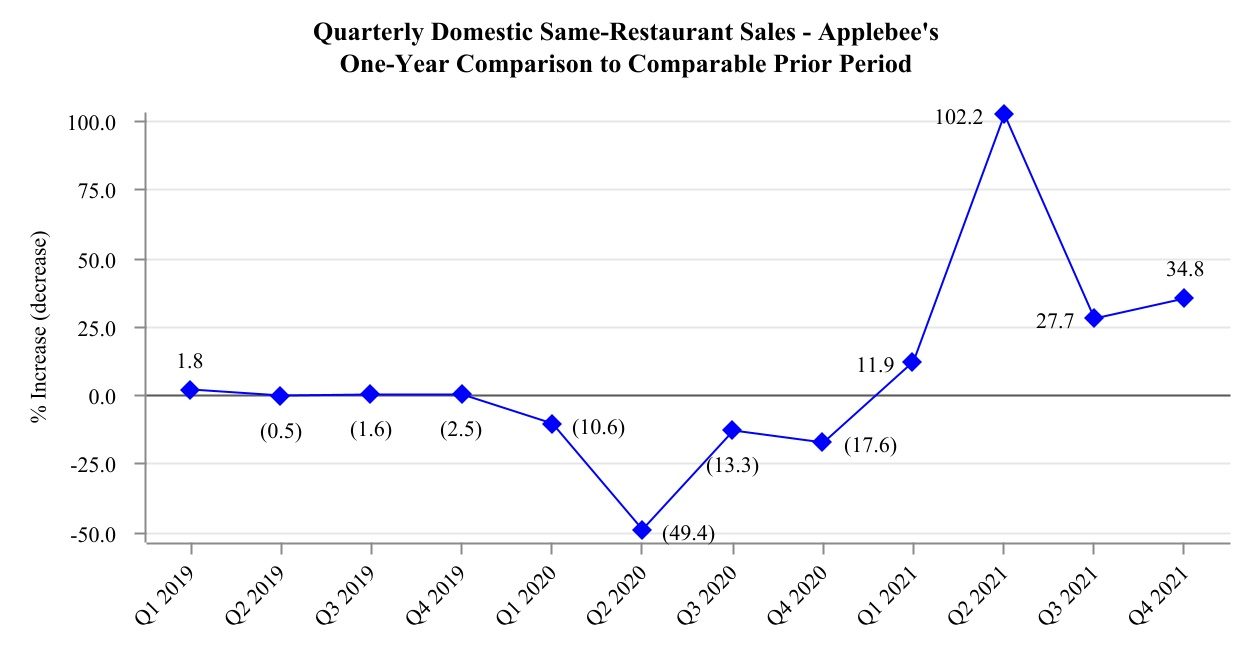
Domestic System-Wide Comparable Same-Restaurant Sales Relative to the Fourth Quarter of 2020
| Domestic Same-Restaurant Sales (Fiscal Month) | ||||||||
|
October |
|
November |
|
December |
|
Q4 2021 |
||
| Applebee’s |
19.2% |
|
36.1% |
|
49.7% |
|
34.8% |
|
|
|
|
|
|
|
|
|
||
| IHOP |
26.1% |
|
40.2% |
|
50.1% |
|
39.2% |
|
- Applebee’s year-over-year comparable same-restaurant sales increased 34.8% for the fourth quarter of 2021.
- IHOP’s year-over-year comparable same-restaurant sales increased 39.2% for the fourth quarter of 2021.
- Both brands outperformed their respective categories in the fourth quarter of 2021 relative to the fourth quarter of 2020, according to Black Box IntelligenceTM.
Domestic System-Wide Comparable Same-Restaurant Sales Relative to the Fourth Quarter of 2019
| Domestic Same-Restaurant Sales (Fiscal Month) | ||||||||
|
October |
|
November |
|
December |
|
Q4 2021 |
||
| Applebee’s |
13.6% |
|
10.0% |
|
5.0% |
|
9.1% |
|
|
|
|
|
|
|
|
|
||
| IHOP |
-3.0% |
|
-1.0% |
|
-4.6% |
|
-3.0% |
|
- Applebee’s two-year comparable same-restaurant sales increased 9.1% for the fourth quarter of 2021 relative to the fourth quarter of 2019.
- IHOP’s two-year comparable same-restaurant sales decreased 3.0% for the fourth quarter of 2021 relative to the fourth quarter of 2019.
- Applebee’s outperformed its category in the fourth quarter of 2021 relative to the fourth quarter of 2019, according to Black Box IntelligenceTM.
Average Weekly Unit Sales Comparison Relative to the Fourth Quarter of 2019
| ($ in thousands) | ||||||
|
Q4 2021 |
|
Q4 2019 |
|
% Change Compared to Pre-Pandemic Sales |
||
| Applebee’s (Domestic Unit Sales) |
$51.9 |
|
$46.1 |
|
12.6% |
|
|
|
|
|
|
|
||
| IHOP |
$37.5 |
|
$37.3 |
|
0.5% |
|
- Applebee’s domestic franchise average weekly unit sales increased 12.6% for the fourth quarter of 2021 relative to the fourth quarter of 2019.
- IHOP’s average weekly unit sales increased 0.5% for the fourth quarter of 2021 relative to the fourth quarter of 2019.
Off-Premise Sales Growth Comparison Relative to the Fourth Quarter of 2020
- Applebee’s off-premise sales accounted for 26.9% of sales mix for the fourth quarter of 2021.
- Applebee’s off-premise average weekly sales were approximately $13,800 for the fourth quarter of 2021 compared to approximately $14,300 for the fourth quarter of 2020.
- IHOP’s off-premise sales accounted for 23.7% of sales mix for the fourth quarter of 2021.
- IHOP’s off-premise average weekly sales were approximately $9,300 for the fourth quarter of 2021 compared to approximately $9,200 for the fourth quarter of 2020.
Fourth Quarter of 2021 Summary
- GAAP earnings per diluted share of $1.14 for the fourth quarter of 2021 compared to a net loss per diluted share of $0.10 for the fourth quarter of 2020. This improvement was primarily due to an increase in gross profit and a decrease in closure and impairment charges, partially offset by an increase in general and administrative expenses and higher income tax expense.
- Adjusted earnings per diluted share of $1.32 for the fourth quarter of 2021 compared to adjusted earnings per diluted share of $0.39 for the fourth quarter of 2020. The increase was primarily due to higher gross profit, partially offset by higher general and administrative expenses. (See “Non-GAAP Financial Measures” and reconciliation of GAAP earnings per diluted share to adjusted earnings per diluted share.)
- General and administrative expenses for the fourth quarter of 2021 were $48.9 million compared to $39.4 million for the fourth quarter of 2020. The variance was mainly due to higher incentive compensation accrual.
- Consolidated adjusted EBITDA for the fourth quarter of 2021 was $60.1 million compared to $42.0 million for the fourth quarter of 2020. (See “Non-GAAP Financial Measures” and reconciliation of GAAP net income to consolidated adjusted EBITDA.)
- Development activity by Applebee’s and IHOP franchisees for the fourth quarter of 2021 resulted in the opening of 15 new restaurants and the closure of 23 restaurants.
Fiscal 2021 Summary
- GAAP earnings per diluted share of $5.66 for 2021 compared to a net loss per diluted share of $6.43 for 2020. This variance was primarily due to closure and impairment charges incurred in 2020 totaling $132.6 million primarily related to the non-cash write-downs of Applebee’s goodwill and other intangible assets because of the impact of COVID-19 on the Company’s operations and higher gross profit for 2021, partially offset by higher general and administrative expenses. There were no similar impairments in 2021.
- Adjusted earnings per diluted share of $6.54 for 2021 compared to adjusted earnings per diluted share of $1.79 for 2020. The increase was primarily due to higher gross profit, partially offset by an increase in general and administrative expenses. (See “Non-GAAP Financial Measures” and reconciliation of GAAP earnings per diluted share to adjusted earnings per diluted share.)
- General and administrative expenses for 2021 were $171.8 million compared to $144.8 million for 2020. The variance was mainly due to higher incentive compensation accrual.
- Consolidated adjusted EBITDA for 2021 was $253.3 million. This compares to $158.7 million for 2020. (See “Non-GAAP Financial Measures” and reconciliation of GAAP net income to consolidated adjusted EBITDA.)
- The Company generated adjusted free cash flow of $191.0 million for 2021. This compares to adjusted free cash flow of $106.6 million for 2020. (See “Non-GAAP Financial Measures” and reconciliation of the Company’s cash provided by operating activities to adjusted free cash flow.)
- Cash flows from operating activities for 2021 were $195.8 million. This compares to cash flows from operating activities of $96.5 million for 2020. The improvement in both adjusted free cash flow and cash flows from operating activities was mainly due to an increase in gross profit and a favorable change in working capital, partially offset by an increase in general and administrative expenses.
- Development activity by Applebee’s and IHOP franchisees for 2021 resulted in the opening of 46 new restaurants and the closure of 96 restaurants. The number of closures in 2021 was 46% lower than in 2020.
Cash Position
As of December 31, 2021, the Company had $425.4 million of total cash, cash equivalents and restricted cash, of which $361.4 million was unrestricted cash. The Company believes that its asset-light business model and cash position will continue to provide strong liquidity during the ongoing recovery from the pandemic.
As of December 31, 2021, the Company’s leverage ratio was 3.86x compared to 4.36x as of September 30, 2021.
As of December 31, 2021, the Company’s debt service coverage ratio was approximately 4.7x compared to approximately 4.8x as of September 30, 2021.
As of December 31, 2021, there were no outstanding borrowings under the revolving credit facility. As of December 31, 2021, $3.3 million was pledged against the revolving credit facility for outstanding letters of credit, leaving $221.7 million available.
GAAP Effective Tax Rate
The Company’s effective tax rate for 2021 was a 19.7% tax expense compared to a 4.2% tax benefit for 2020. The 2021 effective tax rate of 19.7% applied to pretax book income was different than the statutory Federal income tax rate of 21% primarily due to the recognition of excess tax benefits on stock-based compensation. The 2020 effective tax rate of 4.2% applied to pretax book loss was significantly different than the statutory Federal income tax rate of 21% primarily because of the $92.2 million impairment of goodwill incurred, which was not deductible for income tax purposes and therefore had no associated tax benefit.
Capital Return to Shareholders
The Company repurchased 59,099 shares of its common stock in 2021 for a total of approximately $4.5 million. On October 29, 2021, the Company declared a cash dividend of $0.40 per share of common stock for the fourth quarter of 2021, which was paid on January 7, 2022.
On February 22, 2022, the Company announced that its Board of Directors declared and approved a 15% increase in the quarterly cash dividend to $0.46 per share of common stock. The dividend will be payable on April 1, 2022, to the Company’s stockholders of record at the close of business on March 21, 2022.
Effective April 1, 2022, the Company’s Board of Directors also approved a new share repurchase program of up to $250 million and terminated the existing share repurchase program, approved in February 2019. Approximately $66 million remained available for repurchases under the existing share repurchase program as of December 31, 2021.
Financial Performance Guidance for 2022
The Company’s guidance assumes there are no significant disruptions to its business due to COVID-19 during 2022, except for the impact from Omicron in the first quarter. The projections are as of this date. The Company assumes no obligation to update or supplement this information.
- General and administrative expenses are expected to range between approximately $188 million and $198 million, including non-cash stock-based compensation expense and depreciation of approximately $30 million. This range reflects incremental investments in technology and operational initiatives as well as unit development and is inclusive of general and administrative expenses related to the company restaurants segment.
- Capital expenditures are expected to range between $33 million and $38 million, reflecting incremental investments in the business to support sustainable growth.
- Domestic development activity by IHOP franchisees and area licensees are expected to result in net new openings between 50 and 65 restaurants.
- Domestic development activity by Applebee’s franchisees is expected to result in between 5 and 15 net fewer restaurants. In 2021, Applebee’s concluded a strategic initiative to close underperforming domestic restaurants to improve the performance of the franchised system.
- Consolidated adjusted EBITDA is expected to range between approximately $235 million and $250 million. This range is inclusive of adjusted EBITDA related to the company restaurants segment.
Fourth Quarter of 2021 Earnings Conference Call Details
Dine Brands will host a conference call to discuss its results on March 2, 2022 at 9:00 a.m. Eastern time.
To participate on the call, please dial (833) 528-0602 and enter the conference identification number 3224056. International callers, please dial (830) 221-9708 and enter the conference identification number 3224056.
A live webcast of the call will be available on www.dinebrands.com and may be accessed by visiting Events and Presentations under the site’s Investors section. Participants should allow approximately ten minutes prior to the call’s start time to visit the site and download any streaming media software needed to listen to the webcast. A telephonic replay of the call may be accessed from 12:00 p.m. Eastern time on March 2, 2022 through 12:00 p.m. Eastern time on March 9, 2022, by dialing (855) 859-2056 and entering the conference identification number 3224056. International callers, please dial (404) 537-3406 and enter the conference identification number 3224056. An online archive of the webcast will also be available on Events and Presentations under the Investors section of the Company’s website.
Investor and Analyst Day on March 9, 2022
Dine Brands will host an investor and analyst day on March 9, 2022 in New York City. The meeting will consist of presentations by John Peyton, chief executive officer of Dine Brands Global, Inc., and members of the Company’s senior management team.
To learn more about the Company’s growth strategy, the business presentations will begin at approximately 9:30 a.m. Eastern time, followed by a question-and-answer session, and conclude at approximately 1:00 p.m. Eastern time.
Space is limited and in-person attendance is by invitation only. A live webcast, including presentation material, will be available on www.dinebrands.com and may be accessed by visiting Events and Presentations under the site’s Investors section.
About Dine Brands Global, Inc.
Based in Glendale, California, Dine Brands Global, Inc. (NYSE: DIN), through its subsidiaries, franchises restaurants under both Applebee’s Neighborhood Grill + Bar® and IHOP® brands. With over 3,400 restaurants combined in 16 countries and 338 franchisees, Dine Brands is one of the largest full-service restaurant companies in the world. For more information on Dine Brands, visit the Company’s website located at www.dinebrands.com.
Forward-Looking Statements
Statements contained in this press release may constitute forward-looking statements within the meaning of Section 27A of the Securities Act of 1933, as amended, and Section 21E of the Securities Exchange Act of 1934, as amended. You can identify these forward-looking statements by words such as “may,” “will,” “would,” “should,” “could,” “expect,” “anticipate,” “believe,” “estimate,” “intend,” “plan,” “goal” and other similar expressions. These statements involve known and unknown risks, uncertainties and other factors, which may cause actual results to be materially different from those expressed or implied in such statements. These factors include, but are not limited to: uncertainty regarding the duration and severity of the ongoing COVID-19 pandemic and its ultimate impact on the Company; the effectiveness of related containment measures; general economic conditions; our level of indebtedness; compliance with the terms of our securitized debt; our ability to refinance our current indebtedness or obtain additional financing; our dependence on information technology; potential cyber incidents; the implementation of restaurant development plans; our dependence on our franchisees; the concentration of our Applebee’s franchised restaurants in a limited number of franchisees; the financial health of our franchisees; our franchisees’ and other licensees’ compliance with our quality standards and trademark usage; general risks associated with the restaurant industry; potential harm to our brands’ reputation; possible future impairment charges; the effects of tax reform; trading volatility and fluctuations in the price of our stock; our ability to achieve the financial guidance we provide to investors; successful implementation of our business strategy; the availability of suitable locations for new restaurants; shortages or interruptions in the supply or delivery of products from third parties or availability of utilities; the management and forecasting of appropriate inventory levels; development and implementation of innovative marketing and use of social media; changing health or dietary preference of consumers; risks associated with doing
business in international markets; the results of litigation and other legal proceedings; third-party claims with respect to intellectual property assets; our ability to attract and retain management and other key employees; compliance with federal, state and local governmental regulations; risks associated with our self-insurance; natural disasters, pandemics, epidemics, or other serious incidents; our success with development initiatives outside of our core business; the adequacy of our internal controls over financial reporting and future changes in accounting standards; and other factors discussed from time to time in the Corporation’s Annual and Quarterly Reports on Forms 10-K and 10-Q and in the Corporation’s other filings with the Securities and Exchange Commission. The forward-looking statements contained in this press release are made as of the date hereof and the Corporation does not intend to, nor does it assume any obligation to, update or supplement any forward-looking statements after the date hereof to reflect actual results or future events or circumstances.
Non-GAAP Financial Measures
This press release includes references to the Company’s non-GAAP financial measure “adjusted net income available to common stockholders,” “adjusted earnings per diluted share (Adjusted EPS),” “Adjusted EBITDA” and “Adjusted free cash flow.” Adjusted EPS is computed for a given period by deducting from net income or loss available to common stockholders for such period the effect of any closure and impairment charges, any gain or loss related to debt extinguishment, any intangible asset amortization, any non-cash interest expense, any gain or loss related to the disposition of assets, and other items deemed not reflective of current operations. This is presented on an aggregate basis and a per share (diluted) basis. Adjusted EBITDA is computed for a given period by deducting from net income or loss for such period the effect of any closure and impairment charges, any interest charges, any income tax provision or benefit, any non-cash stock-based compensation, any depreciation and amortization, any gain or loss related to the disposition of assets and other items deemed not reflective of current operations. “Adjusted free cash flow” for a given period is defined as cash provided by operating activities, plus receipts from notes and equipment contracts receivable, less capital expenditures. Management may use certain of these non-GAAP financial measures along with the corresponding U.S. GAAP measures to evaluate the performance of the business and to make certain business decisions. Management uses adjusted free cash flow in its periodic assessments of, among other things, the amount of cash dividends per share of common stock and repurchases of common stock and we believe it is important for investors to have the same measure used by management for that purpose. Adjusted free cash flow does not represent residual cash flow available for discretionary purposes. Additionally, adjusted EPS is one of the metrics used in determining payouts under the Company’s annual cash incentive plan. Management believes that these non-GAAP financial measures provide additional meaningful information that should be considered when assessing the business and the Company’s performance compared to prior periods and the marketplace. Adjusted EPS and adjusted free cash flow are supplemental non-GAAP financial measures and should not be considered in isolation or as a substitute for measures of performance prepared in accordance with U.S. GAAP.
|
Dine Brands Global, Inc. and Subsidiaries |
||||||||||||||||
|
Consolidated Statements of Comprehensive Income (Loss) |
||||||||||||||||
|
(In thousands, except per share amounts) |
||||||||||||||||
|
|
|
Three Months Ended |
|
Twelve Months Ended |
||||||||||||
|
|
|
December 31, |
|
December 31, |
||||||||||||
|
|
|
2021 |
|
2020 |
|
2021 |
|
2020 |
||||||||
|
|
|
(Unaudited) |
|
|
|
|
||||||||||
|
Revenues: |
|
|
|
|
|
|
|
|
||||||||
|
Franchise revenues: |
|
|
|
|
|
|
|
|
||||||||
|
Royalties, franchise fees and other |
|
$ |
92,008 |
|
|
$ |
76,044 |
|
|
$ |
357,146 |
|
|
$ |
267,959 |
|
|
Advertising revenues |
|
|
70,872 |
|
|
|
58,744 |
|
|
|
274,790 |
|
|
|
201,494 |
|
|
Total franchise revenues |
|
|
162,880 |
|
|
|
134,788 |
|
|
|
631,936 |
|
|
|
469,453 |
|
|
Company restaurant sales |
|
|
36,582 |
|
|
|
32,627 |
|
|
|
146,000 |
|
|
|
108,054 |
|
|
Rental revenues |
|
|
29,136 |
|
|
|
27,029 |
|
|
|
113,933 |
|
|
|
105,939 |
|
|
Financing revenues |
|
|
1,032 |
|
|
|
1,585 |
|
|
|
4,298 |
|
|
|
5,822 |
|
|
Total revenues |
|
|
229,630 |
|
|
|
196,029 |
|
|
|
896,167 |
|
|
|
689,268 |
|
|
Cost of revenues: |
|
|
|
|
|
|
|
|
||||||||
|
Franchise expenses: |
|
|
|
|
|
|
|
|
||||||||
|
Advertising expenses |
|
|
68,385 |
|
|
|
59,262 |
|
|
|
272,303 |
|
|
|
202,012 |
|
|
Bad debt (credit) expense |
|
|
(682 |
) |
|
|
4,340 |
|
|
|
(4,928 |
) |
|
|
12,756 |
|
|
Other franchise expenses |
|
|
8,315 |
|
|
|
8,205 |
|
|
|
28,512 |
|
|
|
24,204 |
|
|
Total franchise expenses |
|
|
76,018 |
|
|
|
71,807 |
|
|
|
295,887 |
|
|
|
238,972 |
|
|
Company restaurant expenses |
|
|
35,238 |
|
|
|
31,776 |
|
|
|
136,748 |
|
|
|
111,550 |
|
|
Rental expenses: |
|
|
|
|
|
|
|
|
||||||||
|
Interest expense from finance leases |
|
|
769 |
|
|
|
1,110 |
|
|
|
3,446 |
|
|
|
4,563 |
|
|
Other rental expenses |
|
|
21,038 |
|
|
|
23,818 |
|
|
|
84,397 |
|
|
|
84,939 |
|
|
Total rental expenses |
|
|
21,807 |
|
|
|
24,928 |
|
|
|
87,843 |
|
|
|
89,502 |
|
|
Financing expenses |
|
|
108 |
|
|
|
135 |
|
|
|
464 |
|
|
|
528 |
|
|
Total cost of revenues |
|
|
133,171 |
|
|
|
128,646 |
|
|
|
520,942 |
|
|
|
440,552 |
|
|
Gross profit |
|
|
96,459 |
|
|
|
67,383 |
|
|
|
375,225 |
|
|
|
248,716 |
|
|
General and administrative expenses |
|
|
48,947 |
|
|
|
39,440 |
|
|
|
171,838 |
|
|
|
144,791 |
|
|
Interest expense, net |
|
|
15,375 |
|
|
|
17,752 |
|
|
|
63,331 |
|
|
|
66,895 |
|
|
Closure and impairment charges |
|
|
385 |
|
|
|
8,099 |
|
|
|
5,409 |
|
|
|
132,620 |
|
|
Amortization of intangible assets |
|
|
2,664 |
|
|
|
2,663 |
|
|
|
10,679 |
|
|
|
10,903 |
|
|
Loss (gain) on disposition of assets |
|
|
609 |
|
|
|
(561 |
) |
|
|
2,045 |
|
|
|
2,069 |
|
|
Income before income taxes |
|
|
28,479 |
|
|
|
(10 |
) |
|
|
121,923 |
|
|
|
(108,562 |
) |
|
Income tax (provision) benefit |
|
|
(8,691 |
) |
|
|
(1,551 |
) |
|
|
(24,059 |
) |
|
|
4,568 |
|
|
Net income (loss) |
|
$ |
19,788 |
|
|
$ |
(1,561 |
) |
|
$ |
97,864 |
|
|
$ |
(103,994 |
) |
|
Net income (loss) available to common stockholders: |
|
|
|
|
|
|
|
|
||||||||
|
Net income (loss) |
|
$ |
19,788 |
|
|
$ |
(1,561 |
) |
|
$ |
97,864 |
|
|
$ |
(103,994 |
) |
|
Less: Net income allocated to unvested participating restricted stock |
|
|
(409 |
) |
|
|
— |
|
|
|
(2,295 |
) |
|
|
(420 |
) |
|
Net income (loss) available to common stockholders |
|
$ |
19,379 |
|
|
$ |
(1,561 |
) |
|
$ |
95,569 |
|
|
$ |
(104,414 |
) |
|
Net income (loss) available to common stockholders per share: |
|
|
|
|
|
|
|
|
||||||||
|
Basic |
|
$ |
1.14 |
|
|
$ |
(0.10 |
) |
|
$ |
5.69 |
|
|
$ |
(6.43 |
) |
|
Diluted |
|
$ |
1.14 |
|
|
$ |
(0.10 |
) |
|
$ |
5.66 |
|
|
$ |
(6.43 |
) |
|
Weighted average shares outstanding: |
|
|
|
|
|
|
|
|
||||||||
|
Basic |
|
|
16,941 |
|
|
|
16,232 |
|
|
|
16,799 |
|
|
|
16,230 |
|
|
Diluted |
|
|
16,991 |
|
|
|
16,232 |
|
|
|
16,890 |
|
|
|
16,230 |
|
|
|
|
|
|
|
|
|
|
|
||||||||
|
Dividends declared per common share |
|
$ |
0.40 |
|
|
$ |
— |
|
|
$ |
0.40 |
|
|
$ |
0.76 |
|
|
Dividends paid per common share |
|
$ |
— |
|
|
$ |
— |
|
|
$ |
— |
|
|
$ |
1.45 |
|
|
|
|
|
|
|
|
|
|
|
||||||||
|
Dine Brands Global, Inc. and Subsidiaries |
||||||||
|
Consolidated Balance Sheets |
||||||||
|
(In thousands, except share and per share amounts) |
||||||||
|
|
|
December 31, 2021 |
|
December 31, 2020 |
||||
|
Assets |
|
|
|
|
||||
|
Current assets: |
|
|
|
|
||||
|
Cash and cash equivalents |
|
$ |
361,412 |
|
|
$ |
383,369 |
|
|
Receivables, net of allowance of $4,959 (2021) and $15,057 (2020) |
|
|
119,968 |
|
|
|
121,897 |
|
|
Restricted cash |
|
|
47,541 |
|
|
|
39,884 |
|
|
Prepaid gift card costs |
|
|
28,175 |
|
|
|
29,080 |
|
|
Prepaid income taxes |
|
|
10,529 |
|
|
|
6,178 |
|
|
Other current assets |
|
|
6,728 |
|
|
|
6,098 |
|
|
Total current assets |
|
|
574,353 |
|
|
|
586,506 |
|
|
Other intangible assets, net |
|
|
539,390 |
|
|
|
549,671 |
|
|
Operating lease right-of-use assets |
|
|
335,428 |
|
|
|
346,086 |
|
|
Goodwill |
|
|
251,628 |
|
|
|
251,628 |
|
|
Property and equipment, net |
|
|
179,411 |
|
|
|
187,977 |
|
|
Deferred rent receivable |
|
|
50,257 |
|
|
|
56,449 |
|
|
Long-term receivables, net of allowance of $6,897 (2021) and $7,999 (2020) |
|
|
42,493 |
|
|
|
54,512 |
|
|
Non-current restricted cash |
|
|
16,400 |
|
|
|
32,800 |
|
|
Other non-current assets, net |
|
|
10,006 |
|
|
|
9,316 |
|
|
Total assets |
|
$ |
1,999,366 |
|
|
$ |
2,074,945 |
|
|
Liabilities and Stockholders’ Deficit |
|
|
|
|
||||
|
Current liabilities: |
|
|
|
|
||||
|
Current maturities of long-term debt |
|
$ |
— |
|
|
$ |
13,000 |
|
|
Accounts payable |
|
|
55,956 |
|
|
|
37,424 |
|
|
Gift card liability |
|
|
165,530 |
|
|
|
144,159 |
|
|
Current maturities of operating lease obligations |
|
|
72,079 |
|
|
|
69,672 |
|
|
Current maturities of finance lease and financing obligations |
|
|
10,693 |
|
|
|
11,293 |
|
|
Accrued employee compensation and benefits |
|
|
40,785 |
|
|
|
21,237 |
|
|
Accrued advertising |
|
|
33,752 |
|
|
|
21,641 |
|
|
Deferred franchise revenue, short-term |
|
|
7,246 |
|
|
|
7,682 |
|
|
Dividends payable |
|
|
6,919 |
|
|
|
— |
|
|
Other accrued expenses |
|
|
17,770 |
|
|
|
22,460 |
|
|
Total current liabilities |
|
|
410,730 |
|
|
|
348,568 |
|
|
Long-term debt, net, less current maturities |
|
|
1,279,623 |
|
|
|
1,491,996 |
|
|
Operating lease obligations, less current maturities |
|
|
320,848 |
|
|
|
345,163 |
|
|
Finance lease obligations, less current maturities |
|
|
59,625 |
|
|
|
69,012 |
|
|
Financing obligations, less current maturities |
|
|
31,967 |
|
|
|
32,797 |
|
|
Deferred income taxes, net |
|
|
76,228 |
|
|
|
78,293 |
|
|
Deferred franchise revenue, long-term |
|
|
46,100 |
|
|
|
52,237 |
|
|
Other non-current liabilities |
|
|
17,052 |
|
|
|
11,530 |
|
|
Total liabilities |
|
|
2,242,173 |
|
|
|
2,429,596 |
|
|
Commitments and contingencies |
|
|
|
|
||||
|
Stockholders’ deficit: |
|
|
|
|
||||
|
Preferred stock, $1 par value, 10,000,000 shares authorized, no shares issued or outstanding |
|
|
— |
|
|
|
— |
|
|
Common stock, $0.01 par value; shares: 40,000,000 authorized; 2021 -24,992,275 issued, 17,163,946 outstanding; 2020 – 24,882,122 issued, 16,452,174 outstanding |
|
|
250 |
|
|
|
249 |
|
|
Additional paid-in-capital |
|
|
256,189 |
|
|
|
257,625 |
|
|
Retained earnings (accumulated deficit) |
|
|
35,415 |
|
|
|
(55,553 |
) |
|
Accumulated other comprehensive loss |
|
|
(59 |
) |
|
|
(55 |
) |
|
Treasury stock, at cost; shares: 2021 – 7,828,329; 2020 – 8,429,948 |
|
|
(534,602 |
) |
|
|
(556,917 |
) |
|
Total stockholders’ deficit |
|
|
(242,807 |
) |
|
|
(354,651 |
) |
|
Total liabilities and stockholders’ deficit |
|
$ |
1,999,366 |
|
|
$ |
2,074,945 |
|
Contacts
Investor Contact
Ken Diptee
Executive Director, Investor Relations
Dine Brands Global, Inc.
818-637-3632
Ken.Diptee@dinebrands.com
Media Contact
Susan Nelson
Vice President, Global Communications
and Public Affairs
Dine Brands Global, Inc.
Susan.Nelson@dinebrands.com