Hilton Reports Second Quarter Results; Exceeds Expectations and Raises Full Year Outlook
MCLEAN, Va.–(BUSINESS WIRE)–Hilton Worldwide Holdings Inc. (“Hilton” or the “Company”) (NYSE: HLT) today reported its second quarter 2022 results. Highlights include:

![]()
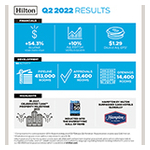
- Diluted EPS was $1.32 for the second quarter, and diluted EPS, adjusted for special items, was $1.29
- Net income was $367 million for the second quarter, exceeding the high end of guidance
- Adjusted EBITDA was $679 million for the second quarter, exceeding the high end of guidance
- System-wide comparable RevPAR increased 54.3 percent, on a currency neutral basis, for the second quarter compared to the same period in 2021
- System-wide comparable RevPAR was down 2.1 percent, on a currency neutral basis, for the second quarter compared to the same period in 2019
- Approved 23,400 new rooms for development during the second quarter, bringing Hilton’s development pipeline to 413,000 rooms as of June 30, 2022
- Added 14,400 rooms to Hilton’s system in the second quarter, contributing to 13,300 net additional rooms in Hilton’s system during the period
- Repurchased 3.6 million shares of Hilton common stock during the second quarter, bringing total capital return, including dividends, to $521 million for the quarter and $812 million year to date through July
- Full year 2022 system-wide comparable RevPAR is expected to increase between 37.0 percent and 43.0 percent, on a currency neutral basis, compared to 2021; full year net income is projected to be between $1,146 million and $1,216 million; full year Adjusted EBITDA is projected to be between $2,400 million and $2,500 million
- Full year 2022 capital return is projected to be between $1.5 billion and $1.9 billion
Overview
Christopher J. Nassetta, President & Chief Executive Officer of Hilton, said, “Our second quarter results exceeded the high end of our guidance for system-wide comparable RevPAR, diluted EPS, adjusted for special items and Adjusted EBITDA. Given our strong results in the quarter, coupled with our confidence in continued recovery throughout the year, we are raising our full year guidance, including our outlook for capital return. With a capital-light business model, a strong portfolio of brands and dynamic, industry-leading platforms, we are well-positioned for the opportunities that lie ahead.”
For the three months ended June 30, 2022, system-wide comparable RevPAR increased 54.3 percent compared to the same period in 2021, due to increases in both occupancy and ADR, and fee revenues increased 54 percent compared to the same period in 2021. For comparison to pre-pandemic results, system-wide comparable RevPAR for the three months ended June 30, 2022 was down 2.1 percent compared to the three months ended June 30, 2019.
For the six months ended June 30, 2022, system-wide comparable RevPAR increased 64.4 percent compared to the same period in 2021, due to increases in both occupancy and ADR, and fee revenues increased 64 percent compared to the same period in 2021. For comparison to pre-pandemic results, system-wide comparable RevPAR for the six months ended June 30, 2022 was down 9.0 percent compared to the six months ended June 30, 2019.
For the three months ended June 30, 2022, diluted EPS was $1.32 and diluted EPS, adjusted for special items, was $1.29 compared to $0.46 and $0.56, respectively, for the three months ended June 30, 2021. Net income and Adjusted EBITDA were $367 million and $679 million, respectively, for the three months ended June 30, 2022, compared to $128 million and $400 million, respectively, for the three months ended June 30, 2021.
For the six months ended June 30, 2022, diluted EPS was $2.07 and diluted EPS, adjusted for special items, was $2.00 compared to $0.08 and $0.58, respectively, for the six months ended June 30, 2021. Net income and Adjusted EBITDA were $578 million and $1,127 million, respectively, for the six months ended June 30, 2022, compared to $19 million and $598 million, respectively, for the six months ended June 30, 2021.
Development
In the second quarter of 2022, Hilton opened 91 new hotels contributing to 14,400 additional rooms and achieved net unit growth of 13,300 rooms. Hilton celebrated notable openings during the quarter, including the Waldorf Astoria Washington, D.C. and the Hotel Marcel New Haven, Tapestry Collection by Hilton, which is anticipated to be the first net-zero hotel in the U.S. Additionally, in July, Hilton celebrated the opening of its 7,000th property, following the recent openings of the Hilton Maldives Amingiri, the Conrad Los Angeles and the Lost Property St. Paul’s London, a Curio Collection hotel.
As of June 30, 2022, Hilton’s development pipeline totaled nearly 2,780 hotels representing more than 413,000 rooms throughout 114 countries and territories, including 29 countries and territories where Hilton does not currently have any existing hotels. Additionally, of the rooms in the development pipeline, more than 195,000 of the rooms were under construction and over 246,000 of the rooms were located outside the U.S.
Balance Sheet and Liquidity
As of June 30, 2022, Hilton had $8.8 billion of long-term debt outstanding, excluding the deduction for deferred financing costs and discount, with a weighted average interest rate of 4.12 percent. Further excluding finance lease liabilities and other debt of Hilton’s consolidated variable interest entities, Hilton had $8.6 billion of long-term debt outstanding with a weighted average interest rate of 4.10 percent and no scheduled maturities until 2025. No debt amounts were outstanding under Hilton’s $1.75 billion senior secured revolving credit facility as of June 30, 2022, which had an available borrowing capacity of $1,690 million after considering $60 million of outstanding letters of credit. Total cash and cash equivalents were $1,254 million as of June 30, 2022, including $79 million of restricted cash and cash equivalents.
During the second quarter of 2022, Hilton repurchased 3.6 million shares of its common stock at a cost of $480 million and an average price per share of $133.32. During the six months ended June 30, 2022, Hilton repurchased 4.5 million shares of its common stock at a cost of $610 million and an average price per share of $135.45. The amount remaining under Hilton’s stock repurchase program is $1.5 billion.
In June 2022, Hilton paid a quarterly cash dividend of $0.15 per share of common stock, for a total of $41 million. In July 2022, Hilton’s board of directors authorized a regular quarterly cash dividend of $0.15 per share of common stock to be paid on or before September 23, 2022 to holders of record of its common stock as of the close of business on August 26, 2022.
Outlook
Share-based metrics in Hilton’s outlook include actual share repurchases to date, but do not include the effect of potential share repurchases hereafter.
Full Year 2022
- System-wide comparable RevPAR, on a currency neutral basis, is expected to increase between 37.0 percent and 43.0 percent compared to 2021, and to be down between 1.0 percent and 5.0 percent from 2019.
- Diluted EPS is projected to be between $4.11 and $4.36.
- Diluted EPS, adjusted for special items, is projected to be between $4.21 and $4.46.
- Net income is projected to be between $1,146 million and $1,216 million.
- Adjusted EBITDA is projected to be between $2,400 million and $2,500 million.
- Contract acquisition costs and capital expenditures, excluding amounts indirectly reimbursed by hotel owners, are expected to be between $250 million and $275 million.
- Capital return is projected to be between $1.5 billion and $1.9 billion.
- General and administrative expenses are projected to be between $400 million and $420 million.
- Net unit growth is expected to be approximately 5.0 percent.
Third Quarter 2022
- System-wide comparable RevPAR, on a currency neutral basis, is expected to increase between 25.0 percent and 30.0 percent compared to the third quarter of 2021, and to increase between 1.0 percent and 5.0 percent from the third quarter of 2019.
- Diluted EPS is projected to be between $1.09 and $1.16.
- Diluted EPS, adjusted for special items, is projected to be between $1.16 and $1.24.
- Net income is projected to be between $303 million and $324 million.
- Adjusted EBITDA is projected to be between $660 million and $690 million.
Conference Call
Hilton will host a conference call to discuss second quarter 2022 results on July 27, 2022 at 10:30 a.m. Eastern Time. Participants may listen to the live webcast by logging on to the Hilton Investor Relations website at https://ir.hilton.com/events-and-presentations. A replay and transcript of the webcast will be available within 24 hours after the live event at https://ir.hilton.com/financial-reporting.
Alternatively, participants may listen to the live call by dialing 1-888-317-6003 in the United States (“U.S.”) or 1-412-317-6061 internationally using the conference ID 6643240. Participants are encouraged to dial into the call or link to the webcast at least fifteen minutes prior to the scheduled start time. A telephone replay will be available for seven days following the call. To access the telephone replay, dial 1-877-344-7529 in the U.S. or 1-412-317-0088 internationally using the conference ID 6537064.
Forward-Looking Statements
This press release contains forward-looking statements within the meaning of Section 27A of the Securities Act of 1933, as amended, and Section 21E of the Securities Exchange Act of 1934, as amended. These statements include, but are not limited to, statements related to the expectations regarding the impact of and recovery from the coronavirus (“COVID-19”) pandemic (the “pandemic”), the performance of Hilton’s business, financial results, liquidity and capital resources and other non-historical statements. In some cases, these forward-looking statements can be identified by the use of words such as “outlook,” “believes,” “expects,” “potential,” “continues,” “may,” “will,” “should,” “could,” “seeks,” “projects,” “predicts,” “intends,” “plans,” “estimates,” “anticipates” or the negative version of these words or other comparable words. Such forward-looking statements are subject to various risks and uncertainties including, among others, risks inherent to the hospitality industry, macroeconomic factors beyond Hilton’s control, such as inflation, changes in interest rates and challenges due to labor shortages and supply chain disruptions, risks related to the impact of the pandemic, including as a result of new strains or variants of the virus and uncertainty of the acceptance and continued effectiveness of the COVID-19 vaccines, competition for hotel guests and management and franchise contracts, risks related to doing business with third-party hotel owners, performance of Hilton’s information technology systems, growth of reservation channels outside of Hilton’s system, risks of doing business outside of the U.S., risks associated with the Russian invasion of Ukraine and Hilton’s indebtedness. Additional factors that could cause Hilton’s results to differ materially from those described in the forward-looking statements can be found under the section entitled “Part I—Item 1A. Risk Factors” of Hilton’s Annual Report on Form 10-K for the fiscal year ended December 31, 2021 and “Part II —Item 1A. Risk Factors” of Hilton’s Quarterly Report on Form 10-Q for the quarterly period ended March 31, 2022, filed with the Securities and Exchange Commission (the “SEC”), as such factors may be updated from time to time in Hilton’s periodic filings with the SEC, which are accessible on the SEC’s website at www.sec.gov. Accordingly, there are or will be important factors that could cause actual outcomes or results to differ materially from those indicated in these statements. These factors should not be construed as exhaustive and should be read in conjunction with the other cautionary statements that are included in this press release and in Hilton’s filings with the SEC. The Company undertakes no obligation to publicly update or review any forward-looking statement, whether as a result of new information, future developments or otherwise, except as required by law.
Definitions
See the “Definitions” section for the definition of certain terms used within this press release, including within the schedules.
Non-GAAP Financial Measures
The Company refers to certain financial measures that are not recognized under U.S. generally accepted accounting principles (“GAAP”) in this press release, including: net income (loss), adjusted for special items; diluted EPS, adjusted for special items; EBITDA; Adjusted EBITDA; Adjusted EBITDA margin; net debt; and net debt to Adjusted EBITDA ratio. See the schedules to this press release, including the “Definitions” section, for additional information and reconciliations of such non-GAAP financial measures.
About Hilton
Hilton (NYSE: HLT) is a leading global hospitality company with a portfolio of 18 world-class brands comprising 7,000 properties and 1.1 million rooms, in 122 countries and territories. Dedicated to fulfilling its founding vision to fill the earth with the light and warmth of hospitality, Hilton has welcomed more than 3 billion guests in its more than 100-year history, earned a top spot on Fortune’s 100 Best Companies to Work For list and been recognized as a global leader on the Dow Jones Sustainability Indices for five consecutive years. Hilton has introduced several industry-leading technology enhancements to improve the guest experience, including Digital Key Share, automated complimentary room upgrades and the ability to book confirmed connecting rooms. Through the award-winning guest loyalty program Hilton Honors, the 139 million members who book directly with Hilton can earn Points for hotel stays and experiences money can’t buy. With the free Hilton Honors app, guests can book their stay, select their room, check in, unlock their door with a Digital Key and check out, all from their smartphone. Visit stories.hilton.com for more information, and connect with Hilton on facebook.com/hiltonnewsroom, twitter.com/hiltonnewsroom, linkedin.com/company/hilton, instagram.com/hiltonnewsroom and youtube.com/hiltonnewsroom.
HILTON WORLDWIDE HOLDINGS INC.
EARNINGS RELEASE SCHEDULES
TABLE OF CONTENTS
|
Condensed Consolidated Statements of Operations |
|
Comparable and Currency Neutral System-Wide Hotel Operating Statistics |
|
Property Summary |
|
Capital Expenditures and Contract Acquisition Costs |
|
Reconciliations of Non-GAAP Financial Measures |
|
Definitions |
HILTON WORLDWIDE HOLDINGS INC.
CONDENSED CONSOLIDATED STATEMENTS OF OPERATIONS
(unaudited, in millions, except per share data)
|
|
Three Months Ended |
|
Six Months Ended |
||||||||||||
|
|
June 30, |
|
June 30, |
||||||||||||
|
|
2022 |
|
2021 |
|
2022 |
|
2021 |
||||||||
|
Revenues |
|
|
|
|
|
|
|
||||||||
|
Franchise and licensing fees |
$ |
545 |
|
|
$ |
369 |
|
|
$ |
958 |
|
|
$ |
611 |
|
|
Base and other management fees |
|
75 |
|
|
|
42 |
|
|
|
130 |
|
|
|
67 |
|
|
Incentive management fees |
|
46 |
|
|
|
21 |
|
|
|
80 |
|
|
|
34 |
|
|
Owned and leased hotels |
|
282 |
|
|
|
121 |
|
|
|
432 |
|
|
|
177 |
|
|
Other revenues |
|
25 |
|
|
|
21 |
|
|
|
43 |
|
|
|
38 |
|
|
|
|
973 |
|
|
|
574 |
|
|
|
1,643 |
|
|
|
927 |
|
|
Other revenues from managed and franchised properties |
|
1,267 |
|
|
|
755 |
|
|
|
2,318 |
|
|
|
1,276 |
|
|
Total revenues |
|
2,240 |
|
|
|
1,329 |
|
|
|
3,961 |
|
|
|
2,203 |
|
|
|
|
|
|
|
|
|
|
||||||||
|
Expenses |
|
|
|
|
|
|
|
||||||||
|
Owned and leased hotels |
|
257 |
|
|
|
142 |
|
|
|
442 |
|
|
|
252 |
|
|
Depreciation and amortization |
|
40 |
|
|
|
46 |
|
|
|
84 |
|
|
|
97 |
|
|
General and administrative |
|
103 |
|
|
|
98 |
|
|
|
194 |
|
|
|
195 |
|
|
Other expenses |
|
11 |
|
|
|
9 |
|
|
|
22 |
|
|
|
19 |
|
|
|
|
411 |
|
|
|
295 |
|
|
|
742 |
|
|
|
563 |
|
|
Other expenses from managed and franchised properties |
|
1,231 |
|
|
|
810 |
|
|
|
2,252 |
|
|
|
1,395 |
|
|
Total expenses |
|
1,642 |
|
|
|
1,105 |
|
|
|
2,994 |
|
|
|
1,958 |
|
|
|
|
|
|
|
|
|
|
||||||||
|
Operating income |
|
598 |
|
|
|
224 |
|
|
|
967 |
|
|
|
245 |
|
|
|
|
|
|
|
|
|
|
||||||||
|
Interest expense |
|
(99 |
) |
|
|
(101 |
) |
|
|
(189 |
) |
|
|
(204 |
) |
|
Gain (loss) on foreign currency transactions |
|
8 |
|
|
|
(1 |
) |
|
|
4 |
|
|
|
1 |
|
|
Loss on debt extinguishment |
|
— |
|
|
|
— |
|
|
|
— |
|
|
|
(69 |
) |
|
Other non-operating income, net |
|
6 |
|
|
|
5 |
|
|
|
22 |
|
|
|
10 |
|
|
|
|
|
|
|
|
|
|
||||||||
|
Income (loss) before income taxes |
|
513 |
|
|
|
127 |
|
|
|
804 |
|
|
|
(17 |
) |
|
|
|
|
|
|
|
|
|
||||||||
|
Income tax benefit (expense) |
|
(146 |
) |
|
|
1 |
|
|
|
(226 |
) |
|
|
36 |
|
|
|
|
|
|
|
|
|
|
||||||||
|
Net income |
|
367 |
|
|
|
128 |
|
|
|
578 |
|
|
|
19 |
|
|
Net loss attributable to noncontrolling interests |
|
1 |
|
|
|
2 |
|
|
|
2 |
|
|
|
3 |
|
|
Net income attributable to Hilton stockholders |
$ |
368 |
|
|
$ |
130 |
|
|
$ |
580 |
|
|
$ |
22 |
|
|
|
|
|
|
|
|
|
|
||||||||
|
Weighted average shares outstanding: |
|
|
|
|
|
|
|
||||||||
|
Basic |
|
278 |
|
|
|
279 |
|
|
|
278 |
|
|
|
278 |
|
|
Diluted |
|
280 |
|
|
|
281 |
|
|
|
281 |
|
|
|
281 |
|
|
|
|
|
|
|
|
|
|
||||||||
|
Earnings per share: |
|
|
|
|
|
|
|
||||||||
|
Basic |
$ |
1.33 |
|
|
$ |
0.47 |
|
|
$ |
2.09 |
|
|
$ |
0.08 |
|
|
Diluted |
$ |
1.32 |
|
|
$ |
0.46 |
|
|
$ |
2.07 |
|
|
$ |
0.08 |
|
|
|
|
|
|
|
|
|
|
||||||||
|
Cash dividends declared per share |
$ |
0.15 |
|
|
$ |
— |
|
|
$ |
0.15 |
|
|
$ |
— |
|
HILTON WORLDWIDE HOLDINGS INC.
COMPARABLE AND CURRENCY NEUTRAL SYSTEM-WIDE HOTEL OPERATING STATISTICS
BY REGION, BRAND AND SEGMENT
(unaudited)
|
|
Three Months Ended June 30, |
|||||||||||||||||
|
|
Occupancy |
|
ADR |
|
RevPAR |
|||||||||||||
|
|
2022 |
|
vs. 2021 |
|
2022 |
|
vs. 2021 |
|
2022 |
|
vs. 2021 |
|||||||
|
By Region |
|
|
|
|
|
|
|
|
|
|
|
|
||||||
|
U.S. |
74.3 |
% |
|
10.4 |
% |
pts. |
|
$ |
162.16 |
|
26.8 |
% |
|
$ |
120.52 |
|
47.3 |
% |
|
Americas (excluding U.S.) |
66.4 |
|
|
30.1 |
|
|
|
|
135.85 |
|
31.4 |
|
|
|
90.17 |
|
140.3 |
|
|
Europe |
72.0 |
|
|
40.7 |
|
|
|
|
151.58 |
|
66.2 |
|
|
|
109.09 |
|
282.8 |
|
|
Middle East & Africa |
60.7 |
|
|
13.8 |
|
|
|
|
152.94 |
|
29.8 |
|
|
|
92.89 |
|
67.9 |
|
|
Asia Pacific |
49.7 |
|
|
(6.2 |
) |
|
|
|
97.52 |
|
6.5 |
|
|
|
48.51 |
|
(5.3 |
) |
|
|
|
|
|
|
|
|
|
|
|
|
|
|
||||||
|
By Brand |
|
|
|
|
|
|
|
|
|
|
|
|
||||||
|
Waldorf Astoria Hotels & Resorts |
57.4 |
% |
|
17.0 |
% |
pts. |
|
$ |
464.07 |
|
13.4 |
% |
|
$ |
266.46 |
|
61.1 |
% |
|
Conrad Hotels & Resorts |
57.2 |
|
|
17.9 |
|
|
|
|
273.10 |
|
46.5 |
|
|
|
156.16 |
|
113.2 |
|
|
Canopy by Hilton |
65.6 |
|
|
20.7 |
|
|
|
|
200.88 |
|
27.0 |
|
|
|
131.86 |
|
85.4 |
|
|
Hilton Hotels & Resorts |
64.8 |
|
|
22.1 |
|
|
|
|
186.11 |
|
32.0 |
|
|
|
120.67 |
|
100.1 |
|
|
Curio Collection by Hilton |
64.9 |
|
|
17.2 |
|
|
|
|
230.02 |
|
24.2 |
|
|
|
149.34 |
|
68.9 |
|
|
DoubleTree by Hilton |
66.2 |
|
|
15.9 |
|
|
|
|
139.89 |
|
25.3 |
|
|
|
92.55 |
|
64.9 |
|
|
Tapestry Collection by Hilton |
68.0 |
|
|
17.5 |
|
|
|
|
173.40 |
|
27.1 |
|
|
|
117.86 |
|
71.2 |
|
|
Embassy Suites by Hilton |
73.2 |
|
|
14.9 |
|
|
|
|
178.27 |
|
26.3 |
|
|
|
130.52 |
|
58.5 |
|
|
Hilton Garden Inn |
71.7 |
|
|
11.7 |
|
|
|
|
143.48 |
|
26.4 |
|
|
|
102.91 |
|
51.2 |
|
|
Hampton by Hilton |
72.8 |
|
|
6.3 |
|
|
|
|
133.46 |
|
21.1 |
|
|
|
97.19 |
|
32.6 |
|
|
Tru by Hilton |
74.7 |
|
|
7.5 |
|
|
|
|
128.33 |
|
21.9 |
|
|
|
95.81 |
|
35.5 |
|
|
Homewood Suites by Hilton |
81.8 |
|
|
5.4 |
|
|
|
|
153.96 |
|
26.4 |
|
|
|
125.89 |
|
35.3 |
|
|
Home2 Suites by Hilton |
81.5 |
|
|
3.2 |
|
|
|
|
138.64 |
|
22.1 |
|
|
|
112.93 |
|
27.1 |
|
|
|
|
|
|
|
|
|
|
|
|
|
|
|
||||||
|
By Segment |
|
|
|
|
|
|
|
|
|
|
|
|
||||||
|
Management and franchise |
70.9 |
% |
|
11.8 |
% |
pts. |
|
$ |
154.07 |
|
26.9 |
% |
|
$ |
109.19 |
|
52.2 |
% |
|
Ownership(1) |
64.4 |
|
|
41.7 |
|
|
|
|
210.22 |
|
52.8 |
|
|
|
135.33 |
|
334.4 |
|
|
|
|
|
|
|
|
|
|
|
|
|
|
|
||||||
|
System-wide |
70.8 |
% |
|
12.3 |
% |
pts. |
|
$ |
154.92 |
|
27.5 |
% |
|
$ |
109.62 |
|
54.3 |
% |
HILTON WORLDWIDE HOLDINGS INC.
COMPARABLE AND CURRENCY NEUTRAL SYSTEM-WIDE HOTEL OPERATING STATISTICS (continued)
BY REGION, BRAND AND SEGMENT
(unaudited)
|
|
Six Months Ended June 30, |
|||||||||||||||||
|
|
Occupancy |
|
ADR |
|
RevPAR |
|||||||||||||
|
|
2022 |
|
vs. 2021 |
|
2022 |
|
vs. 2021 |
|
2022 |
|
vs. 2021 |
|||||||
|
By Region |
|
|
|
|
|
|
|
|
|
|
|
|
||||||
|
U.S. |
68.2 |
% |
|
12.3 |
% |
pts. |
|
$ |
154.12 |
|
30.1 |
% |
|
$ |
105.13 |
|
58.7 |
% |
|
Americas (excluding U.S.) |
58.6 |
|
|
25.9 |
|
|
|
|
131.78 |
|
33.4 |
|
|
|
77.26 |
|
139.2 |
|
|
Europe |
60.0 |
|
|
34.9 |
|
|
|
|
139.10 |
|
67.8 |
|
|
|
83.52 |
|
300.7 |
|
|
Middle East & Africa |
63.8 |
|
|
20.0 |
|
|
|
|
156.12 |
|
32.0 |
|
|
|
99.57 |
|
92.4 |
|
|
Asia Pacific |
46.1 |
|
|
(3.3 |
) |
|
|
|
100.63 |
|
9.1 |
|
|
|
46.41 |
|
1.8 |
|
|
|
|
|
|
|
|
|
|
|
|
|
|
|
||||||
|
By Brand |
|
|
|
|
|
|
|
|
|
|
|
|
||||||
|
Waldorf Astoria Hotels & Resorts |
52.6 |
% |
|
20.3 |
% |
pts. |
|
$ |
524.96 |
|
13.0 |
% |
|
$ |
276.33 |
|
83.8 |
% |
|
Conrad Hotels & Resorts |
51.5 |
|
|
16.7 |
|
|
|
|
253.90 |
|
40.9 |
|
|
|
130.82 |
|
108.6 |
|
|
Canopy by Hilton |
59.6 |
|
|
21.9 |
|
|
|
|
194.64 |
|
29.4 |
|
|
|
115.96 |
|
104.5 |
|
|
Hilton Hotels & Resorts |
57.3 |
|
|
21.1 |
|
|
|
|
178.85 |
|
34.1 |
|
|
|
102.46 |
|
112.5 |
|
|
Curio Collection by Hilton |
59.1 |
|
|
18.4 |
|
|
|
|
223.15 |
|
25.0 |
|
|
|
131.83 |
|
81.7 |
|
|
DoubleTree by Hilton |
59.7 |
|
|
16.7 |
|
|
|
|
134.28 |
|
27.8 |
|
|
|
80.20 |
|
77.4 |
|
|
Tapestry Collection by Hilton |
60.7 |
|
|
17.9 |
|
|
|
|
160.80 |
|
27.2 |
|
|
|
97.67 |
|
80.5 |
|
|
Embassy Suites by Hilton |
66.5 |
|
|
15.6 |
|
|
|
|
171.10 |
|
30.0 |
|
|
|
113.75 |
|
69.7 |
|
|
Hilton Garden Inn |
65.6 |
|
|
12.8 |
|
|
|
|
134.98 |
|
29.2 |
|
|
|
88.50 |
|
60.7 |
|
|
Hampton by Hilton |
66.8 |
|
|
8.6 |
|
|
|
|
126.93 |
|
24.3 |
|
|
|
84.79 |
|
42.5 |
|
|
Tru by Hilton |
68.9 |
|
|
9.9 |
|
|
|
|
121.03 |
|
26.5 |
|
|
|
83.40 |
|
47.6 |
|
|
Homewood Suites by Hilton |
77.8 |
|
|
7.6 |
|
|
|
|
145.47 |
|
27.1 |
|
|
|
113.17 |
|
40.8 |
|
|
Home2 Suites by Hilton |
77.7 |
|
|
6.7 |
|
|
|
|
131.57 |
|
23.8 |
|
|
|
102.18 |
|
35.5 |
|
|
|
|
|
|
|
|
|
|
|
|
|
|
|
||||||
|
By Segment |
|
|
|
|
|
|
|
|
|
|
|
|
||||||
|
Management and franchise |
64.8 |
% |
|
13.1 |
% |
pts. |
|
$ |
147.20 |
|
29.7 |
% |
|
$ |
95.38 |
|
62.7 |
% |
|
Ownership(1) |
51.2 |
|
|
33.4 |
|
|
|
|
197.63 |
|
44.9 |
|
|
|
101.26 |
|
316.3 |
|
|
|
|
|
|
|
|
|
|
|
|
|
|
|
||||||
|
System-wide |
64.6 |
% |
|
13.5 |
% |
pts. |
|
$ |
147.87 |
|
30.1 |
% |
|
$ |
95.47 |
|
64.4 |
% |
| ____________ | |
| (1) |
Includes hotels owned or leased by entities in which Hilton owns a noncontrolling financial interest. |
HILTON WORLDWIDE HOLDINGS INC.
PROPERTY SUMMARY
As of June 30, 2022
|
|
Owned / Leased(1) |
|
Managed |
|
Franchised |
|
Total |
||||||||
|
|
Properties |
|
Rooms |
|
Properties |
|
Rooms |
|
Properties |
|
Rooms |
|
Properties |
|
Rooms |
|
Waldorf Astoria Hotels & Resorts |
|
|
|
|
|
|
|
|
|
|
|
|
|
|
|
|
U.S. |
— |
|
— |
|
12 |
|
4,488 |
|
— |
|
— |
|
12 |
|
4,488 |
|
Americas (excluding U.S.) |
— |
|
— |
|
2 |
|
252 |
|
— |
|
— |
|
2 |
|
252 |
|
Europe |
2 |
|
463 |
|
4 |
|
898 |
|
— |
|
— |
|
6 |
|
1,361 |
|
Middle East & Africa |
— |
|
— |
|
5 |
|
1,232 |
|
— |
|
— |
|
5 |
|
1,232 |
|
Asia Pacific |
— |
|
— |
|
6 |
|
1,259 |
|
— |
|
— |
|
6 |
|
1,259 |
|
LXR Hotels & Resorts |
|
|
|
|
|
|
|
|
|
|
|
|
|
|
|
|
U.S. |
— |
|
— |
|
— |
|
— |
|
3 |
|
426 |
|
3 |
|
426 |
|
Americas (excluding U.S.) |
— |
|
— |
|
— |
|
— |
|
1 |
|
76 |
|
1 |
|
76 |
|
Europe |
— |
|
— |
|
1 |
|
70 |
|
1 |
|
307 |
|
2 |
|
377 |
|
Middle East & Africa |
— |
|
— |
|
1 |
|
41 |
|
1 |
|
234 |
|
2 |
|
275 |
|
Asia Pacific |
— |
|
— |
|
— |
|
— |
|
1 |
|
114 |
|
1 |
|
114 |
|
Conrad Hotels & Resorts |
|
|
|
|
|
|
|
|
|
|
|
|
|
|
|
|
U.S. |
— |
|
— |
|
5 |
|
1,922 |
|
2 |
|
1,730 |
|
7 |
|
3,652 |
|
Americas (excluding U.S.) |
— |
|
— |
|
3 |
|
787 |
|
— |
|
— |
|
3 |
|
787 |
|
Europe |
— |
|
— |
|
4 |
|
1,155 |
|
1 |
|
107 |
|
5 |
|
1,262 |
|
Middle East & Africa |
1 |
|
614 |
|
3 |
|
1,569 |
|
— |
|
— |
|
4 |
|
2,183 |
|
Asia Pacific |
1 |
|
164 |
|
22 |
|
7,074 |
|
1 |
|
659 |
|
24 |
|
7,897 |
|
Canopy by Hilton |
|
|
|
|
|
|
|
|
|
|
|
|
|
|
|
|
U.S. |
— |
|
— |
|
— |
|
— |
|
25 |
|
4,296 |
|
25 |
|
4,296 |
|
Americas (excluding U.S.) |
— |
|
— |
|
2 |
|
272 |
|
— |
|
— |
|
2 |
|
272 |
|
Europe |
— |
|
— |
|
1 |
|
123 |
|
4 |
|
917 |
|
5 |
|
1,040 |
|
Middle East & Africa |
— |
|
— |
|
1 |
|
200 |
|
— |
|
— |
|
1 |
|
200 |
|
Asia Pacific |
— |
|
— |
|
4 |
|
614 |
|
— |
|
— |
|
4 |
|
614 |
|
Signia by Hilton |
|
|
|
|
|
|
|
|
|
|
|
|
|
|
|
|
U.S. |
— |
|
— |
|
2 |
|
1,814 |
|
— |
|
— |
|
2 |
|
1,814 |
|
Hilton Hotels & Resorts |
|
|
|
|
|
|
|
|
|
|
|
|
|
|
|
|
U.S. |
— |
|
— |
|
58 |
|
43,443 |
|
186 |
|
58,595 |
|
244 |
|
102,038 |
|
Americas (excluding U.S.) |
1 |
|
405 |
|
29 |
|
11,298 |
|
26 |
|
7,826 |
|
56 |
|
19,529 |
|
Europe |
39 |
|
11,514 |
|
44 |
|
14,927 |
|
43 |
|
11,268 |
|
126 |
|
37,709 |
|
Middle East & Africa |
5 |
|
1,992 |
|
36 |
|
12,555 |
|
3 |
|
1,565 |
|
44 |
|
16,112 |
|
Asia Pacific |
5 |
|
2,999 |
|
113 |
|
39,555 |
|
8 |
|
3,247 |
|
126 |
|
45,801 |
|
Curio Collection by Hilton |
|
|
|
|
|
|
|
|
|
|
|
|
|
|
|
|
U.S. |
— |
|
— |
|
8 |
|
3,595 |
|
61 |
|
13,381 |
|
69 |
|
16,976 |
|
Americas (excluding U.S.) |
— |
|
— |
|
2 |
|
99 |
|
15 |
|
2,004 |
|
17 |
|
2,103 |
|
Europe |
— |
|
— |
|
4 |
|
360 |
|
22 |
|
2,931 |
|
26 |
|
3,291 |
|
Middle East & Africa |
— |
|
— |
|
4 |
|
741 |
|
2 |
|
557 |
|
6 |
|
1,298 |
|
Asia Pacific |
— |
|
— |
|
4 |
|
773 |
|
2 |
|
248 |
|
6 |
|
1,021 |
|
DoubleTree by Hilton |
|
|
|
|
|
|
|
|
|
|
|
|
|
|
|
|
U.S. |
— |
|
— |
|
32 |
|
10,585 |
|
342 |
|
77,829 |
|
374 |
|
88,414 |
|
Americas (excluding U.S.) |
— |
|
— |
|
3 |
|
587 |
|
36 |
|
7,246 |
|
39 |
|
7,833 |
|
Europe |
— |
|
— |
|
14 |
|
3,580 |
|
109 |
|
18,589 |
|
123 |
|
22,169 |
|
Middle East & Africa |
— |
|
— |
|
18 |
|
4,710 |
|
5 |
|
568 |
|
23 |
|
5,278 |
|
Asia Pacific |
— |
|
— |
|
77 |
|
20,593 |
|
6 |
|
1,568 |
|
83 |
|
22,161 |
HILTON WORLDWIDE HOLDINGS INC.
PROPERTY SUMMARY (continued)
As of June 30, 2022
|
|
Owned / Leased(1) |
|
Managed |
|
Franchised |
|
Total |
||||||||
|
|
Properties |
|
Rooms |
|
Properties |
|
Rooms |
|
Properties |
|
Rooms |
|
Properties |
|
Rooms |
|
Tapestry Collection by Hilton |
|
|
|
|
|
|
|
|
|
|
|
|
|
|
|
|
U.S. |
— |
|
— |
|
— |
|
— |
|
69 |
|
8,444 |
|
69 |
|
8,444 |
|
Americas (excluding U.S.) |
— |
|
— |
|
1 |
|
138 |
|
6 |
|
647 |
|
7 |
|
785 |
|
Europe |
— |
|
— |
|
— |
|
— |
|
6 |
|
360 |
|
6 |
|
360 |
|
Asia Pacific |
— |
|
— |
|
1 |
|
266 |
|
1 |
|
175 |
|
2 |
|
441 |
|
Embassy Suites by Hilton |
|
|
|
|
|
|
|
|
|
|
|
|
|
|
|
|
U.S. |
— |
|
— |
|
39 |
|
10,371 |
|
215 |
|
48,458 |
|
254 |
|
58,829 |
|
Americas (excluding U.S.) |
— |
|
— |
|
2 |
|
354 |
|
6 |
|
1,649 |
|
8 |
|
2,003 |
|
Motto by Hilton |
|
|
|
|
|
|
|
|
|
|
|
|
|
|
|
|
U.S. |
— |
|
— |
|
— |
|
— |
|
3 |
|
871 |
|
3 |
|
871 |
|
Hilton Garden Inn |
|
|
|
|
|
|
|
|
|
|
|
|
|
|
|
|
U.S. |
— |
|
— |
|
5 |
|
527 |
|
733 |
|
101,364 |
|
738 |
|
101,891 |
|
Americas (excluding U.S.) |
— |
|
— |
|
13 |
|
1,992 |
|
51 |
|
7,664 |
|
64 |
|
9,656 |
|
Europe |
— |
|
— |
|
18 |
|
3,499 |
|
59 |
|
9,515 |
|
77 |
|
13,014 |
|
Middle East & Africa |
— |
|
— |
|
17 |
|
3,555 |
|
3 |
|
474 |
|
20 |
|
4,029 |
|
Asia Pacific |
— |
|
— |
|
50 |
|
11,085 |
|
2 |
|
321 |
|
52 |
|
11,406 |
|
Hampton by Hilton |
|
|
|
|
|
|
|
|
|
|
|
|
|
|
|
|
U.S. |
— |
|
— |
|
26 |
|
3,366 |
|
2,293 |
|
226,729 |
|
2,319 |
|
230,095 |
|
Americas (excluding U.S.) |
— |
|
— |
|
13 |
|
1,644 |
|
112 |
|
13,604 |
|
125 |
|
15,248 |
|
Europe |
— |
|
— |
|
16 |
|
2,697 |
|
104 |
|
16,161 |
|
120 |
|
18,858 |
|
Middle East & Africa |
— |
|
— |
|
4 |
|
1,238 |
|
— |
|
— |
|
4 |
|
1,238 |
|
Asia Pacific |
— |
|
— |
|
— |
|
— |
|
248 |
|
39,928 |
|
248 |
|
39,928 |
|
Tru by Hilton |
|
|
|
|
|
|
|
|
|
|
|
|
|
|
|
|
U.S. |
— |
|
— |
|
— |
|
— |
|
219 |
|
21,360 |
|
219 |
|
21,360 |
|
Americas (excluding U.S.) |
— |
|
— |
|
— |
|
— |
|
3 |
|
333 |
|
3 |
|
333 |
|
Homewood Suites by Hilton |
|
|
|
|
|
|
|
|
|
|
|
|
|
|
|
|
U.S. |
— |
|
— |
|
9 |
|
1,131 |
|
498 |
|
56,998 |
|
507 |
|
58,129 |
|
Americas (excluding U.S.) |
— |
|
— |
|
3 |
|
406 |
|
24 |
|
2,688 |
|
27 |
|
3,094 |
|
Home2 Suites by Hilton |
|
|
|
|
|
|
|
|
|
|
|
|
|
|
|
|
U.S. |
— |
|
— |
|
2 |
|
210 |
|
530 |
|
55,660 |
|
532 |
|
55,870 |
|
Americas (excluding U.S.) |
— |
|
— |
|
— |
|
— |
|
7 |
|
753 |
|
7 |
|
753 |
|
Asia Pacific |
— |
|
— |
|
— |
|
— |
|
12 |
|
1,715 |
|
12 |
|
1,715 |
|
Other |
— |
|
— |
|
3 |
|
1,343 |
|
5 |
|
1,217 |
|
8 |
|
2,560 |
|
Total hotels |
54 |
|
18,151 |
|
746 |
|
234,993 |
|
6,115 |
|
833,376 |
|
6,915 |
|
1,086,520 |
|
Hilton Grand Vacations |
— |
|
— |
|
— |
|
— |
|
68 |
|
11,801 |
|
68 |
|
11,801 |
|
Total system |
54 |
|
18,151 |
|
746 |
|
234,993 |
|
6,183 |
|
845,177 |
|
6,983 |
|
1,098,321 |
Contacts
Investors
Jill Slattery
+1 703 883 5476
Media
Kent Landers
+1 703 883 3246